Introduction
For my capstone project as part of IBM’s Professional Certificate in Data Science I created a machine learning model that would predict the severity of a car accident based off of the lighting conditions, road conditions, and weather. This project has many practical uses. Being able to better predict how severe an accident is enables emergency services to more effectively triage in cases of multiple accidents. It could also optimize navigation apps ability to suggest alternate routes.
Import Libraries and Load Data
#Import libraries
import numpy as np
import pandas as pd
import sklearn
%matplotlib inline
import matplotlib as mpl
import matplotlib.pyplot as plt
import seaborn as sns

#Load data
!wget -O Data-Collisions.csv https://raw.githubusercontent.com/chrisgray40/Coursera_Capstone/master/Data-Collisions.csv
df = pd.read_csv('Data-Collisions.csv', error_bad_lines=False)
Initial Data Exploration
#Keep only the relevant variables in the data frame
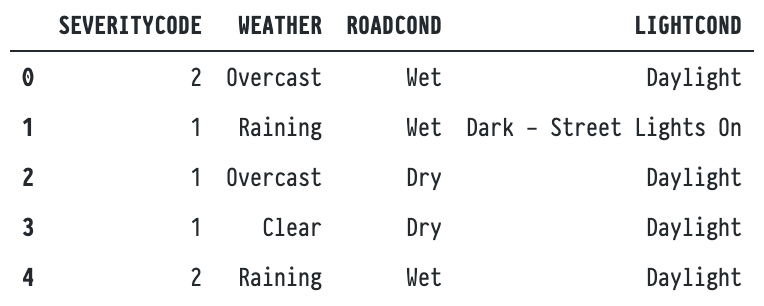
df = df[['SEVERITYCODE', 'WEATHER', 'ROADCOND', 'LIGHTCOND']]
df.head()
#Dropping NaN values
df.dropna(subset=['WEATHER', 'ROADCOND', 'LIGHTCOND'], inplace=True)
df.info()
Weather
df['WEATHER'].value_counts().plot(kind = 'bar')
plt.show()
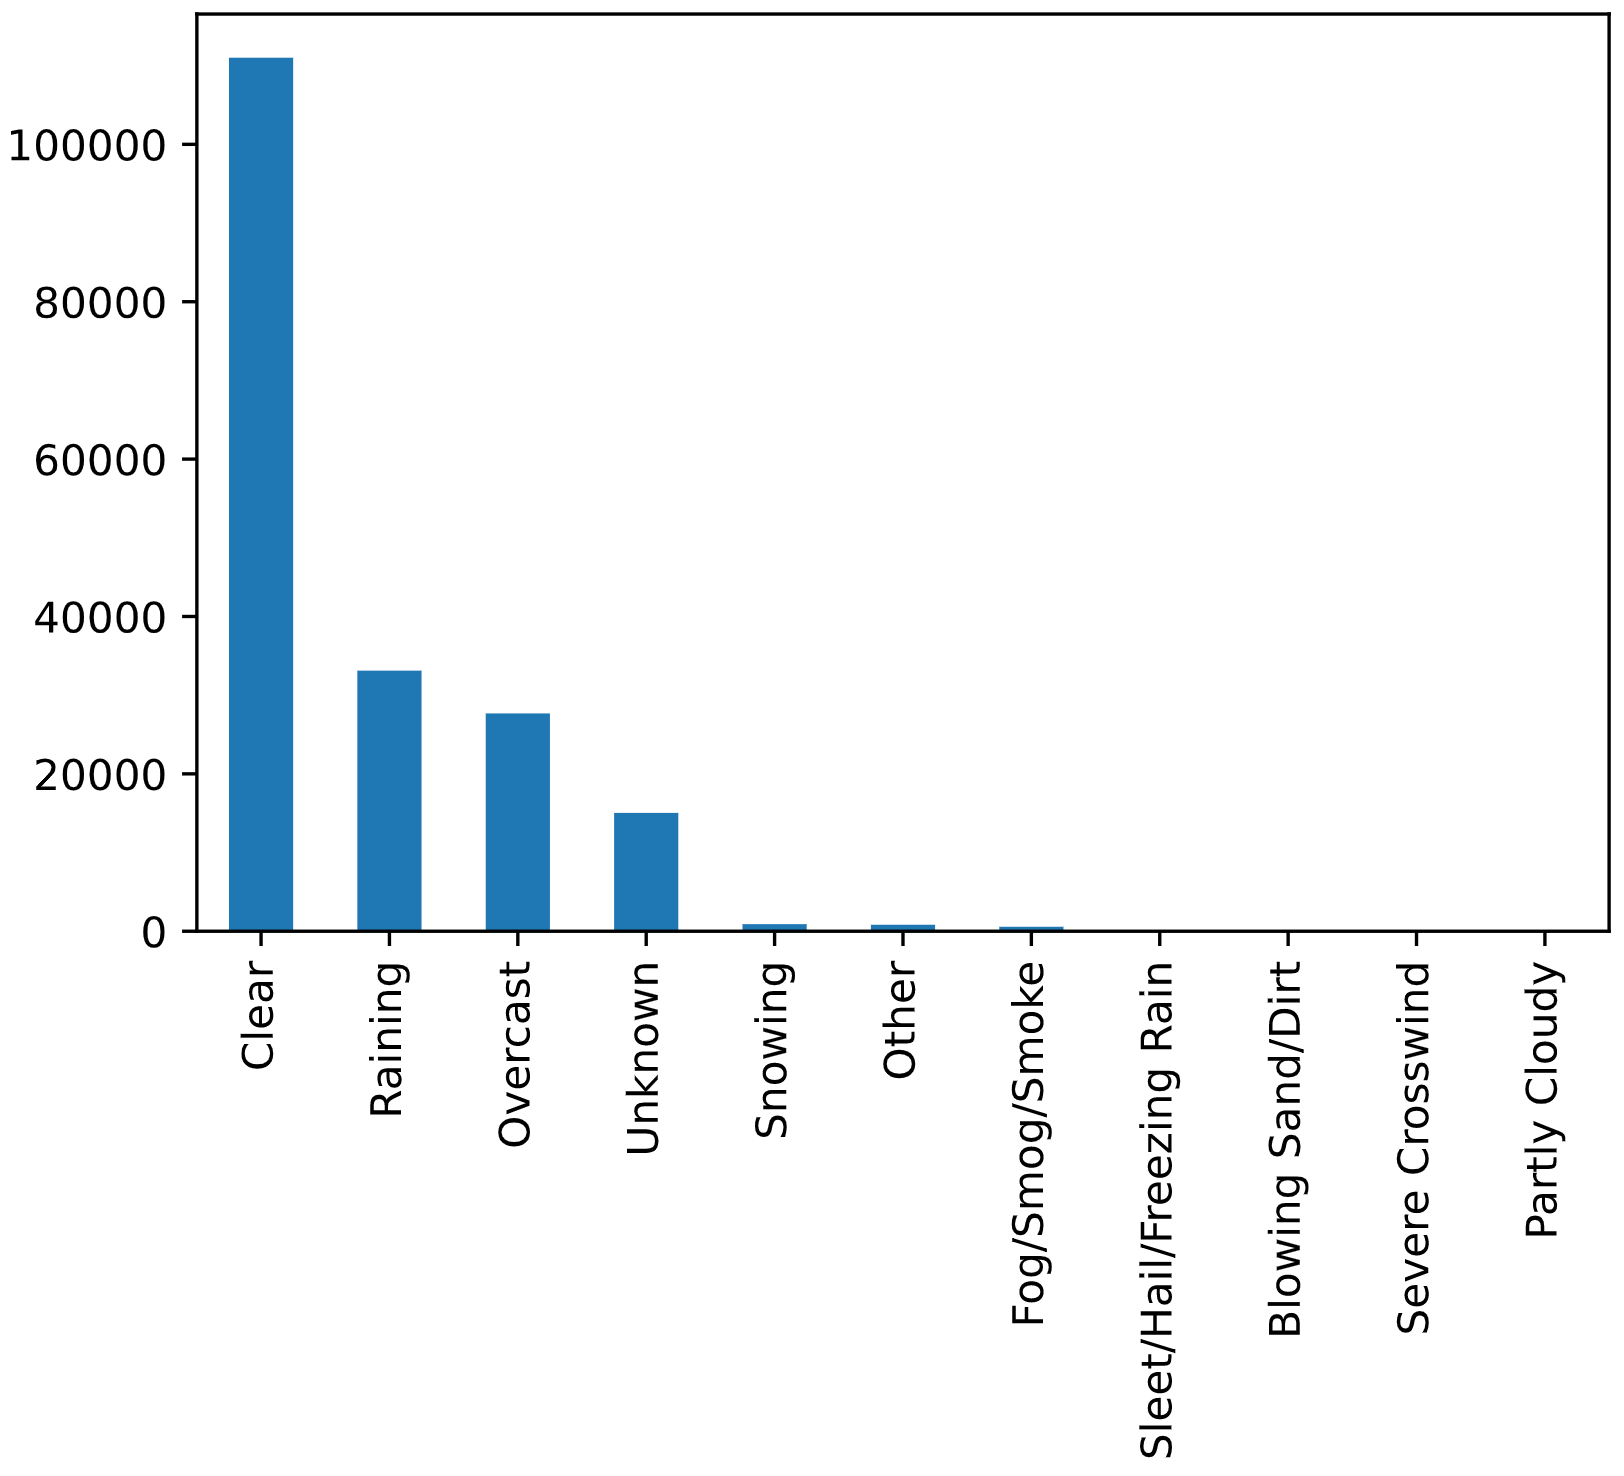
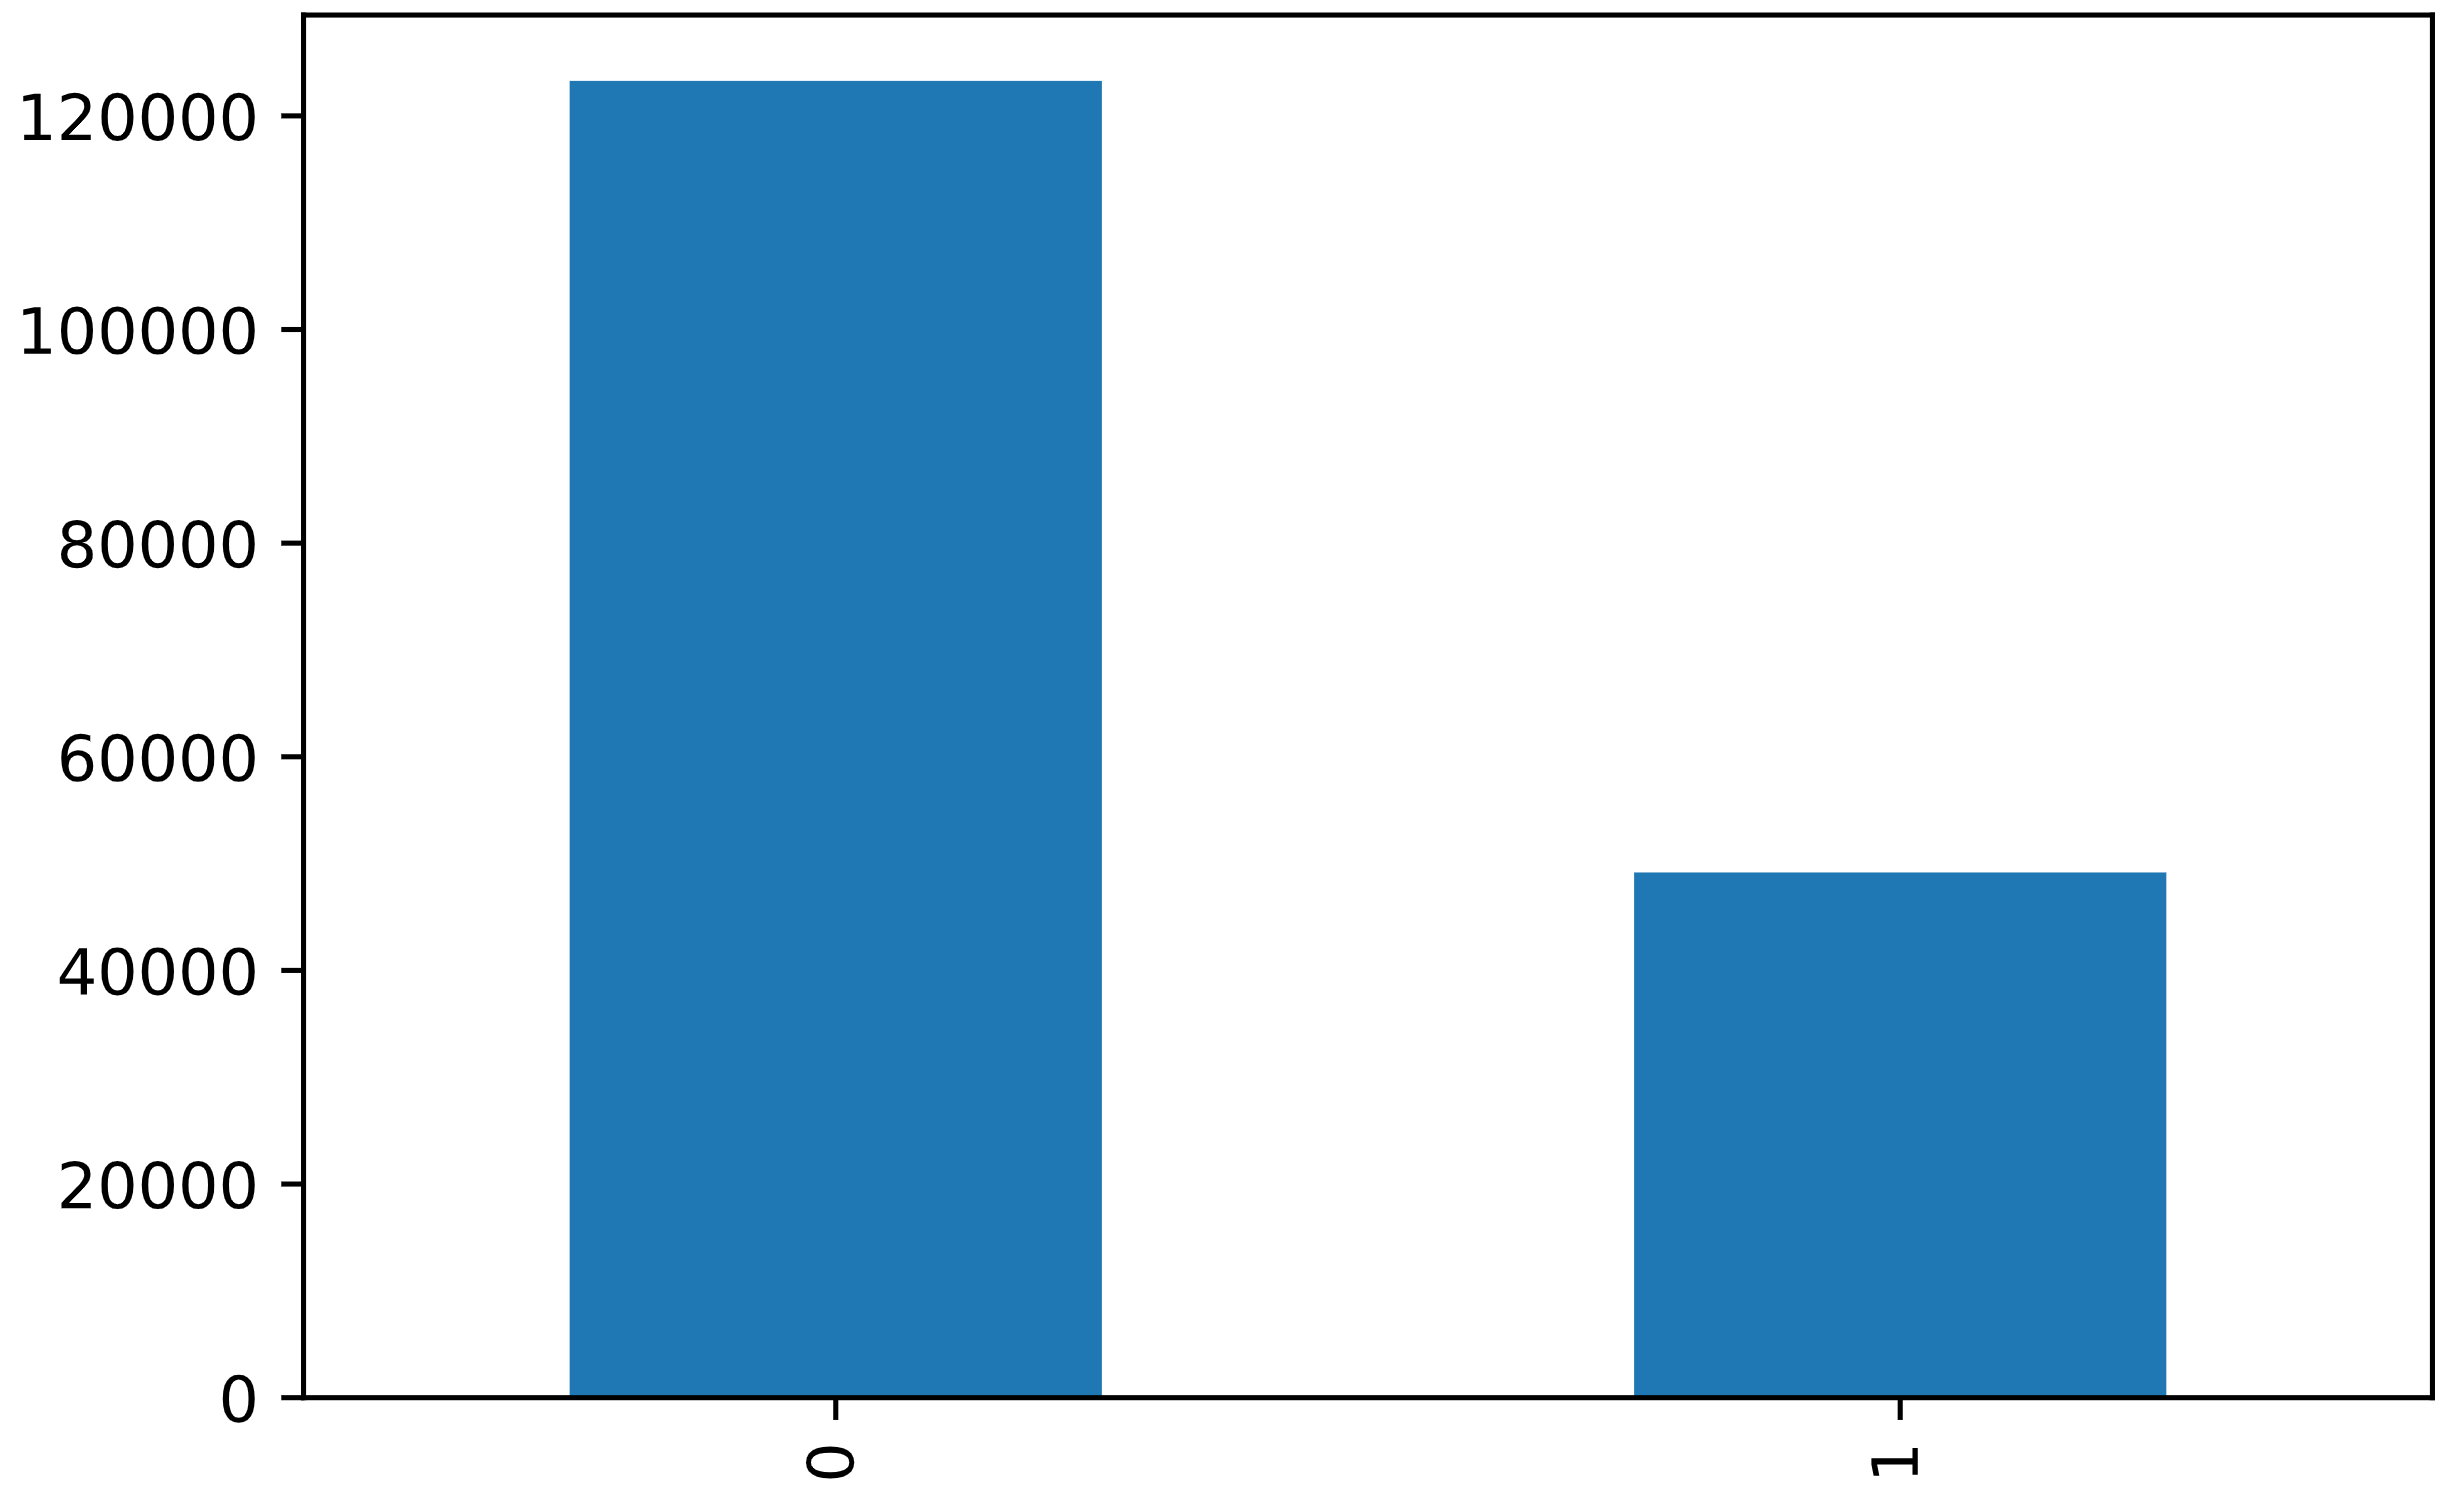
We see that there are 11 different weather values. The next step is to replace the acceptable weather conditions with “0” and adverse conditions with “1”. We’ll also be removing “Unknown” and “Other” conditions as they can’t be analyzed.
df['WEATHER'].replace(to_replace = ['Clear', 'Overcast', 'Partly Cloudy', 'Raining', 'Fog/Smog/Smoke','Sleet/Hail/Freezing Rain', 'Blowing Sand/Dirt', 'Severe Crosswind', 'Snowing'],
value = [0,0,0,1,1,1, 1,1,1],
inplace = True)
df = df[df.WEATHER != 'Other']
df = df[df.WEATHER != 'Unknown']
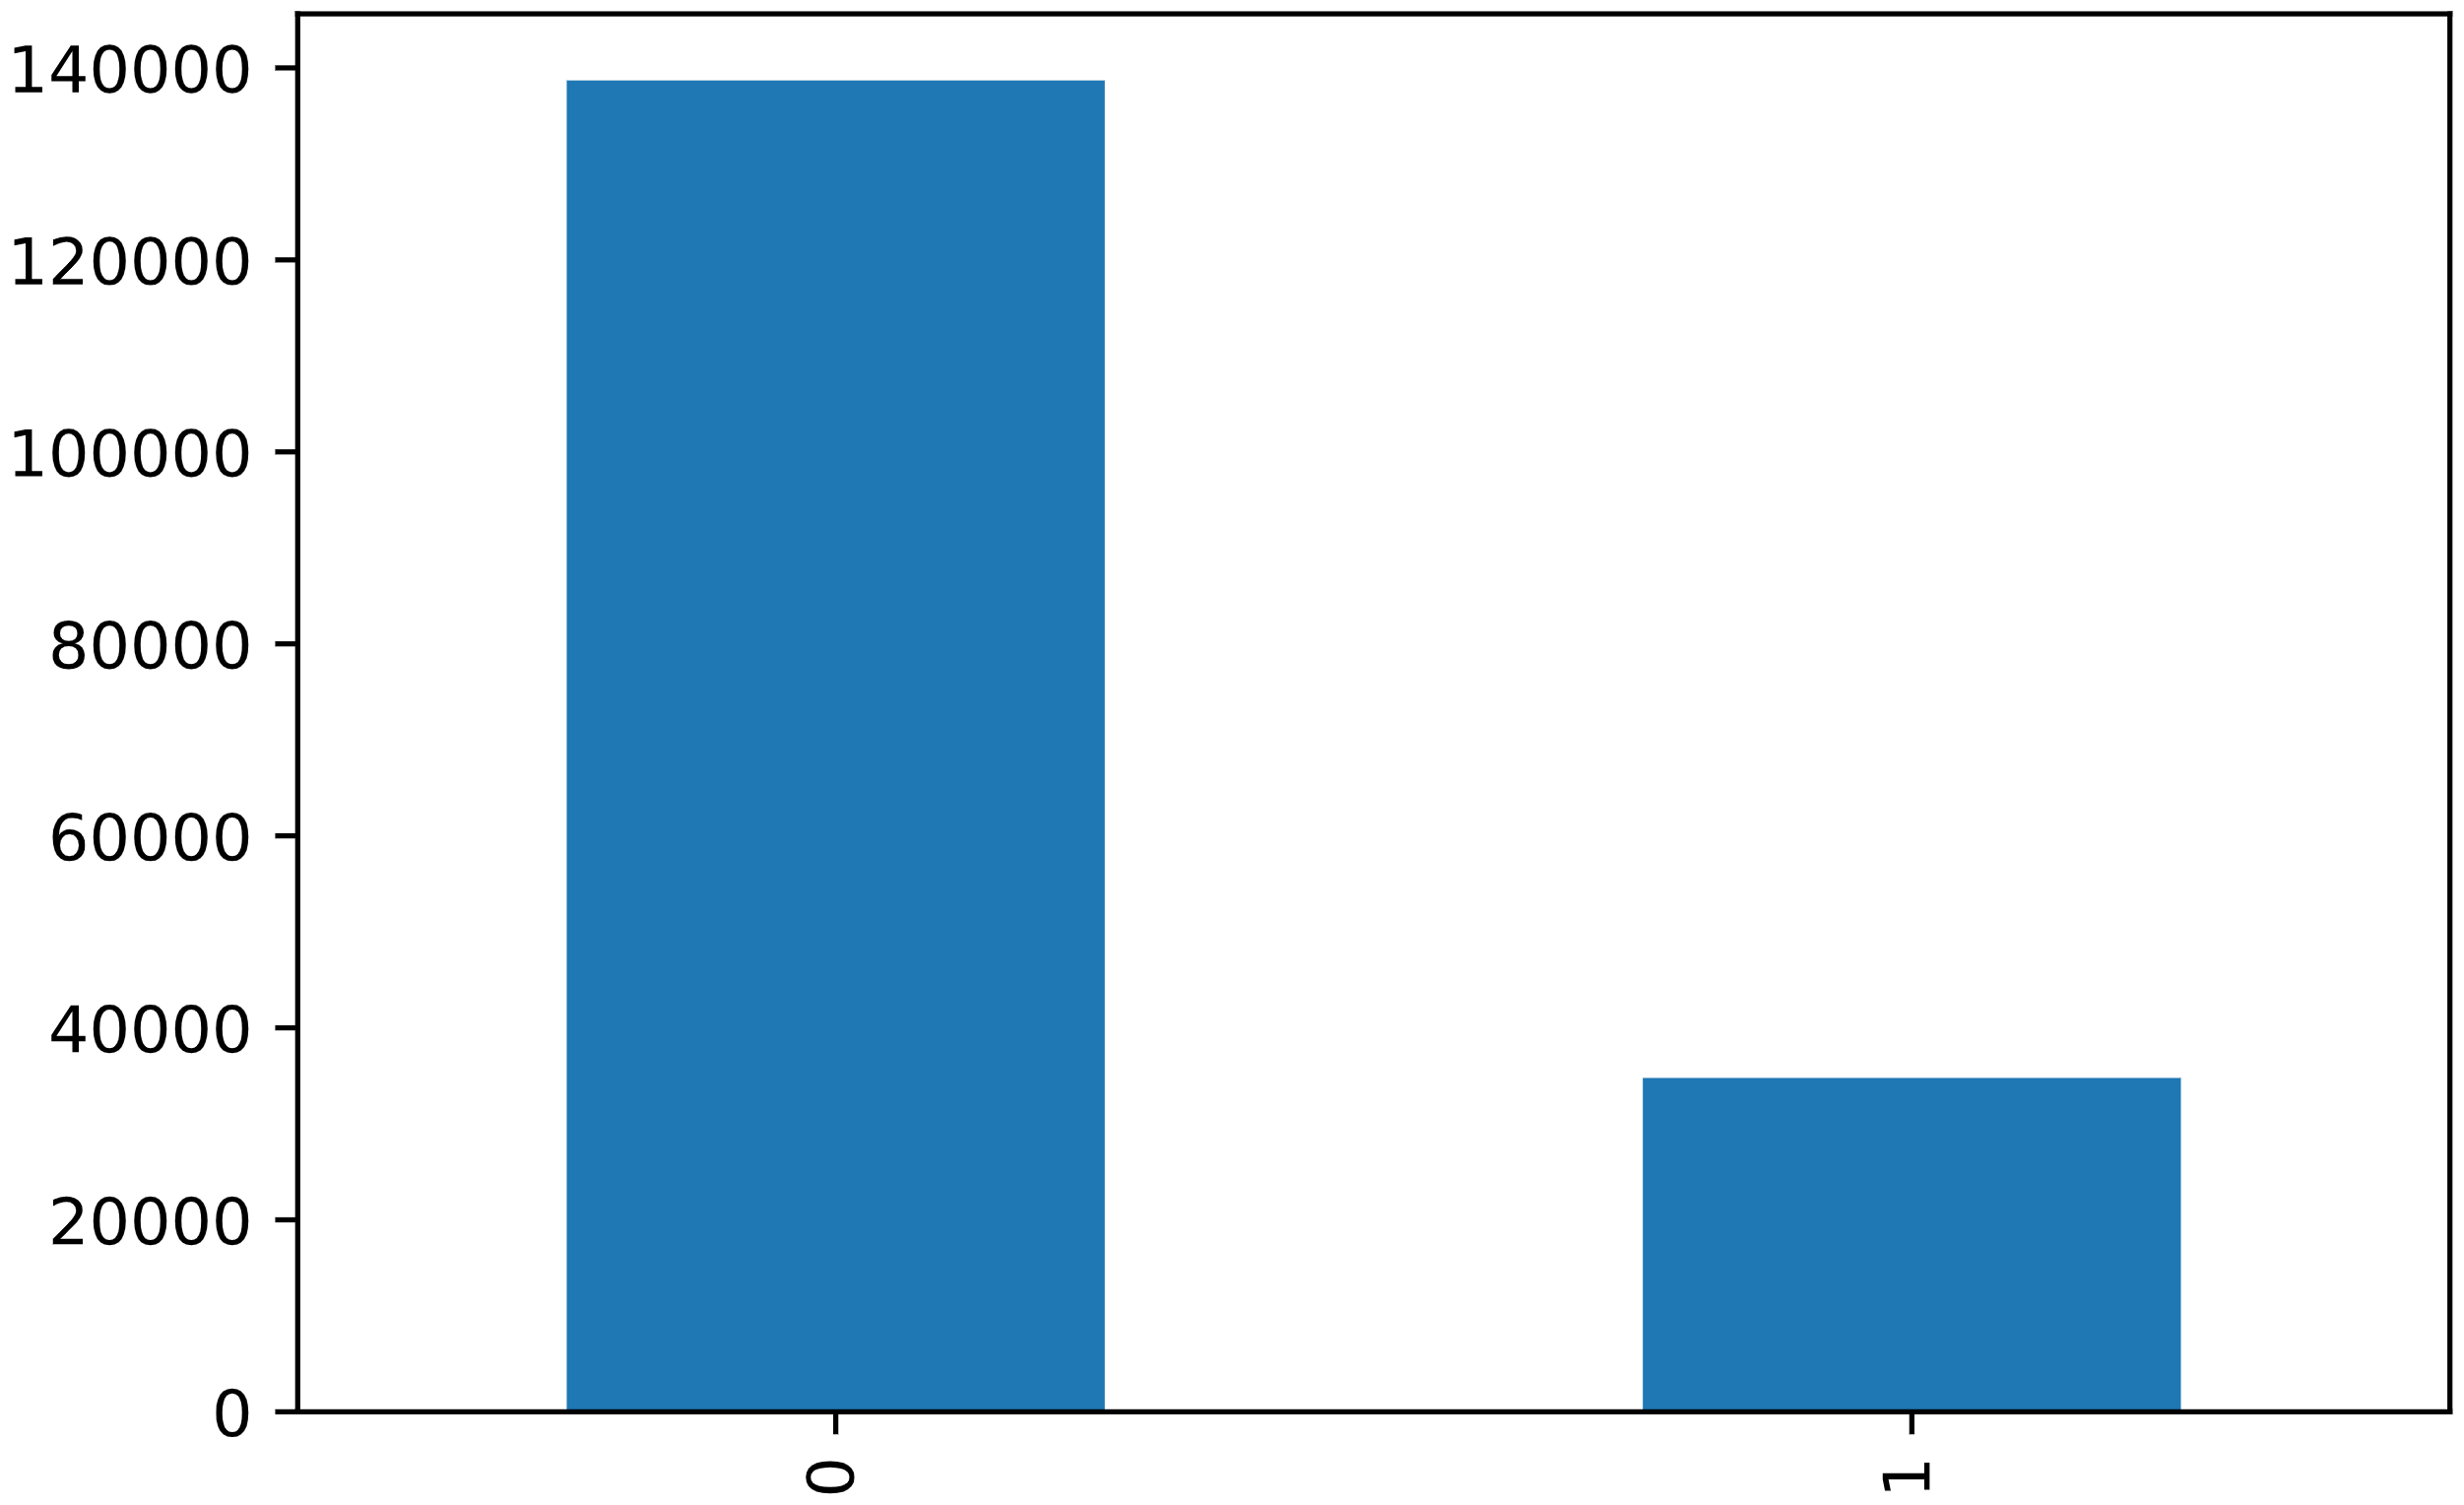
df['WEATHER'].value_counts().plot(kind = 'bar')
plt.show()
Road Conditions
df_road = pd.DataFrame(df['ROADCOND'].value_counts())
df_road.index.name = 'type'
df_road.reset_index(inplace = True)
df_road['%'] = (df_road['ROADCOND']/df_road['ROADCOND'].sum())*100
df['ROADCOND'].value_counts().plot(kind  = 'bar')
plt.show()
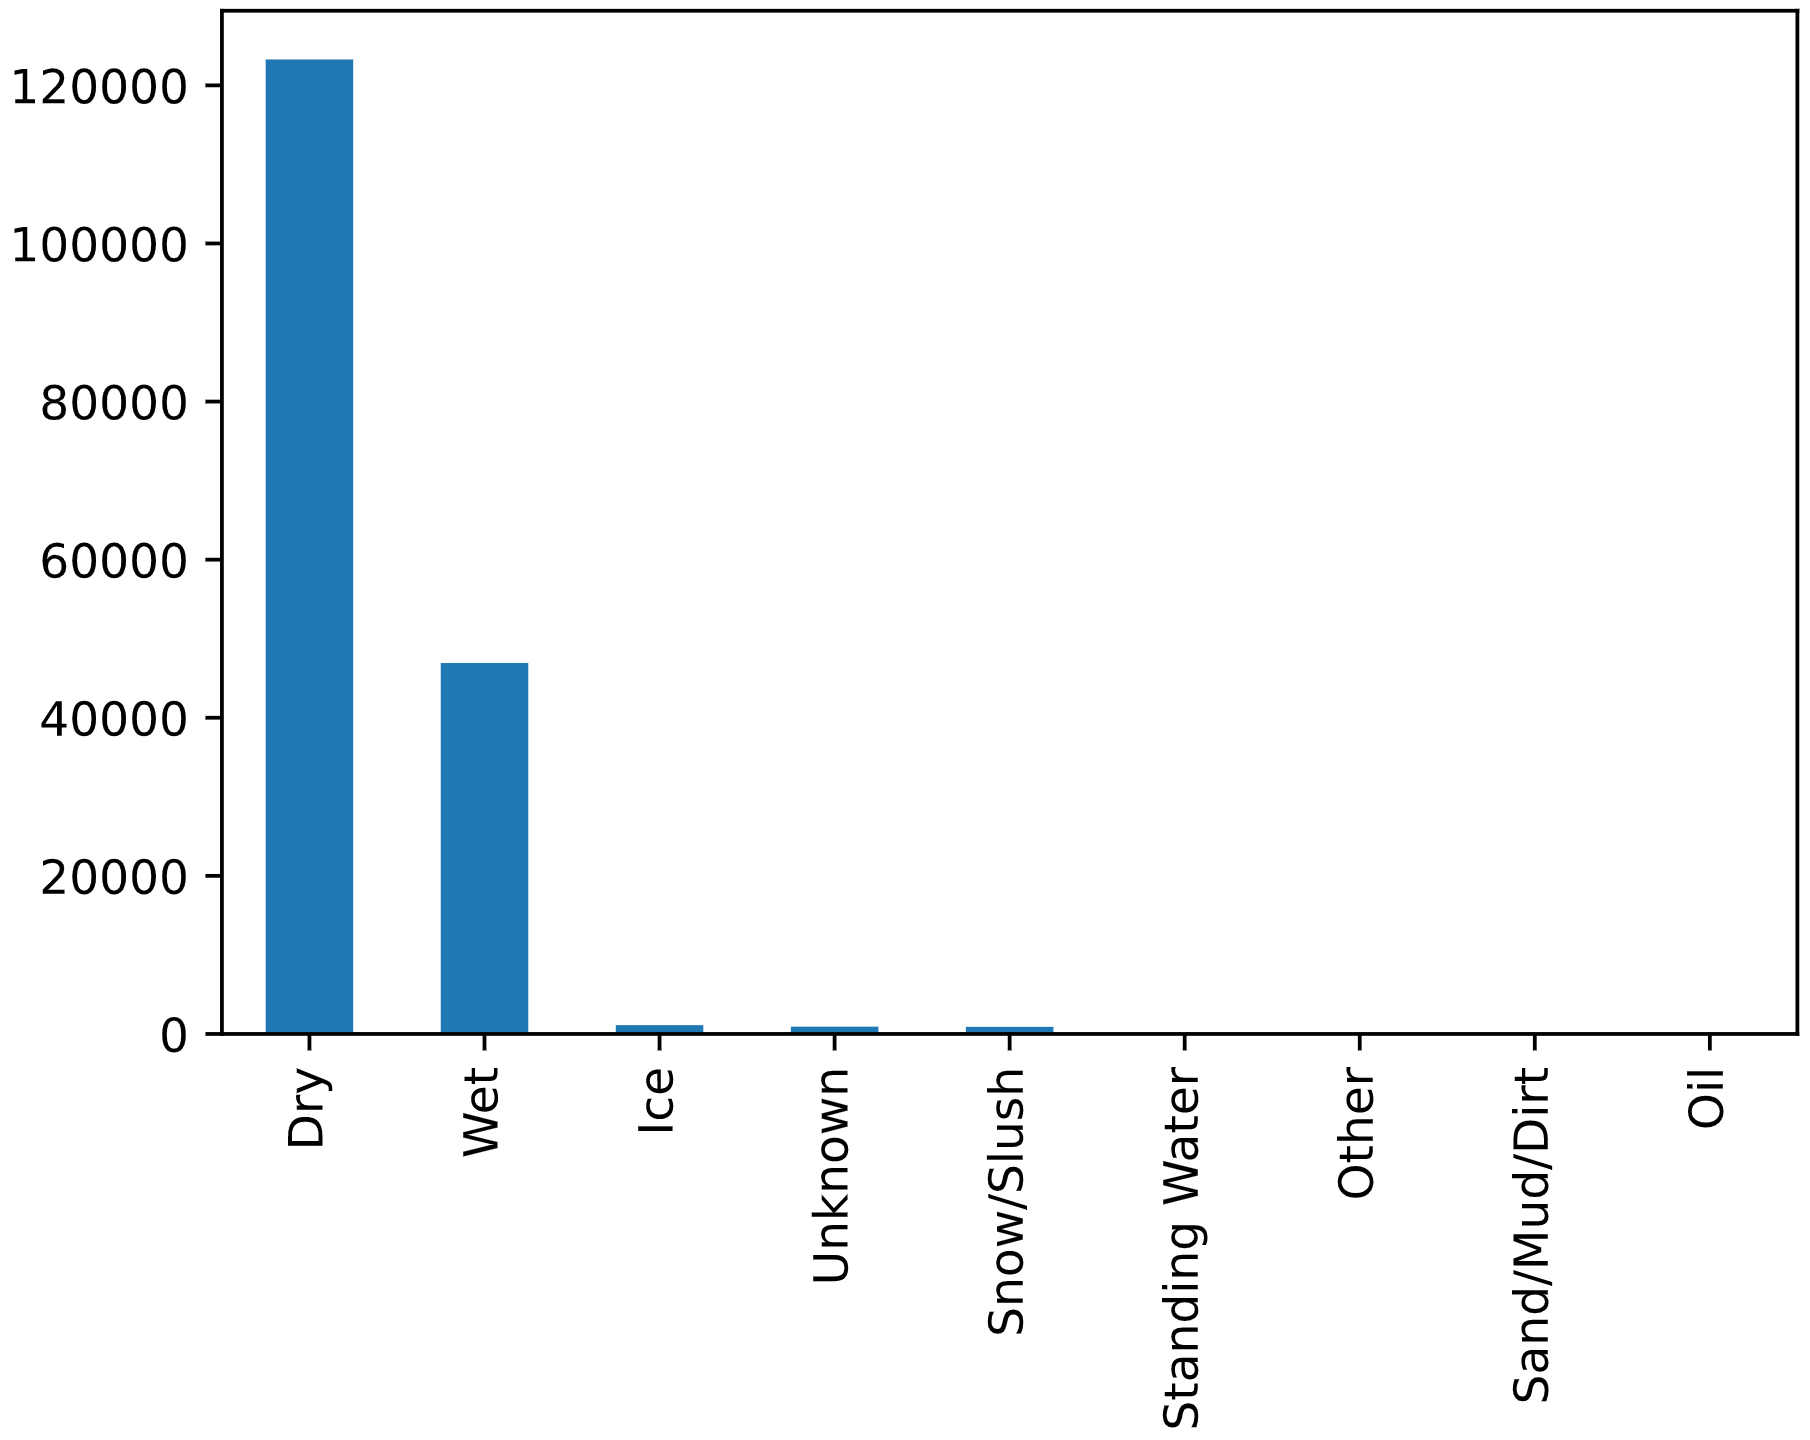
There are 9 road condition values. With the exception of “Dry” they are all adverse. Once again, we’ll drop “Unknown” and “Other” and replace “Dry” with “1” and the adverse conditions with “0”.
df['ROADCOND'].replace(to_replace = ['Dry', 'Wet', 'Ice', 'Snow/Slush', 'Standing Water','Sand/Mud/Dirt', 'Oil'],
                        value = [0,1,1,1,1,1,1],
                        inplace = True)
df = df[df.ROADCOND != 'Unknown']
df = df[df.ROADCOND != 'Other']
df['ROADCOND'].value_counts().plot(kind = 'bar')
plt.show()
Light Conditions
df['LIGHTCOND'].value_counts().plot(kind = 'bar')
plt.show()
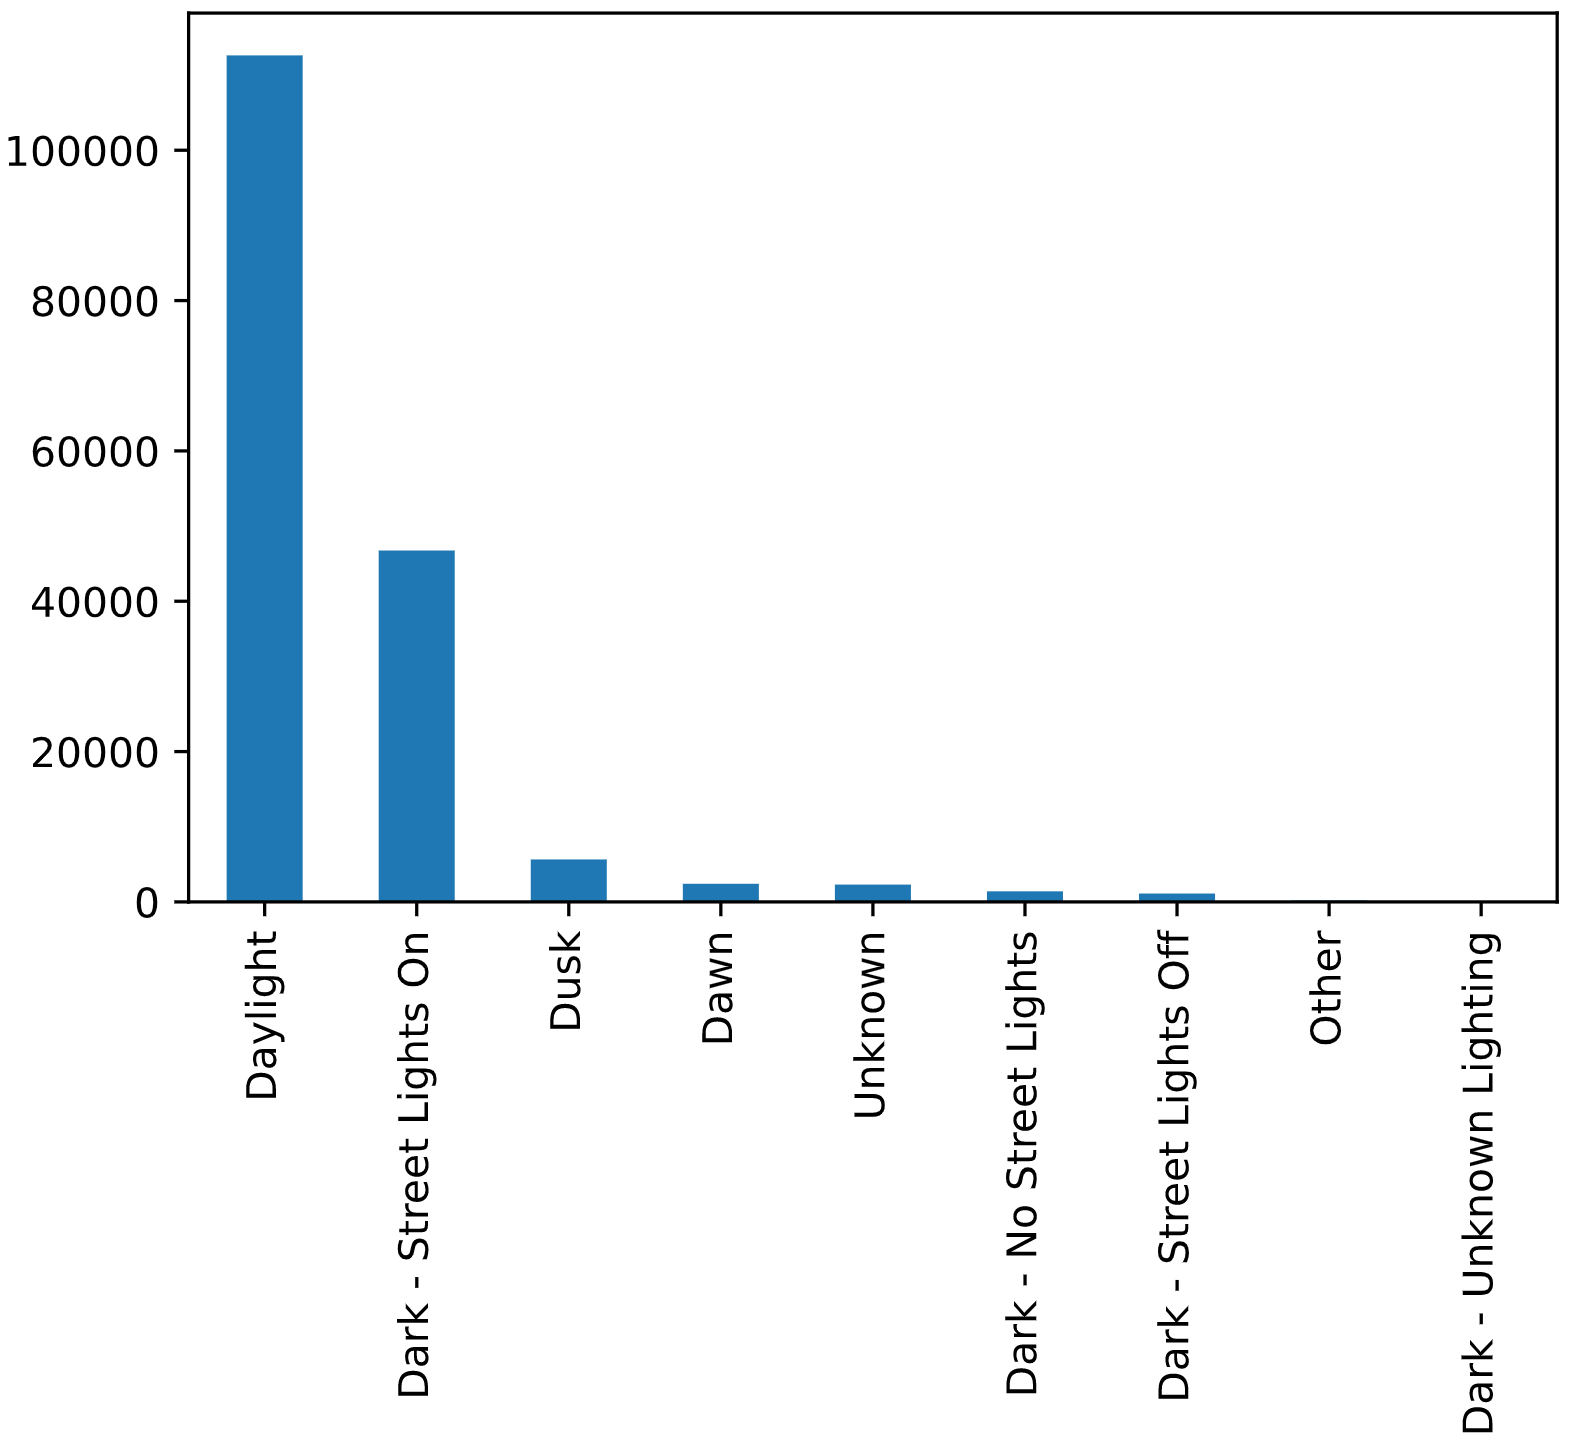
There are 9 light conditions values which can be divided into good visibility and low visibility.
df['LIGHTCOND'].replace(to_replace = ['Daylight', 'Dusk', 'Dawn', 'Dark - No Street Lights', 'Dark - Street Lights Off','Dark - Unknown Lighting', 'Dark - Street Lights On'],
value = [0,0,0,1,1,1, 1],
inplace = True)
df = df[df.LIGHTCOND != 'Unknown']
df = df[df.LIGHTCOND != 'Other']
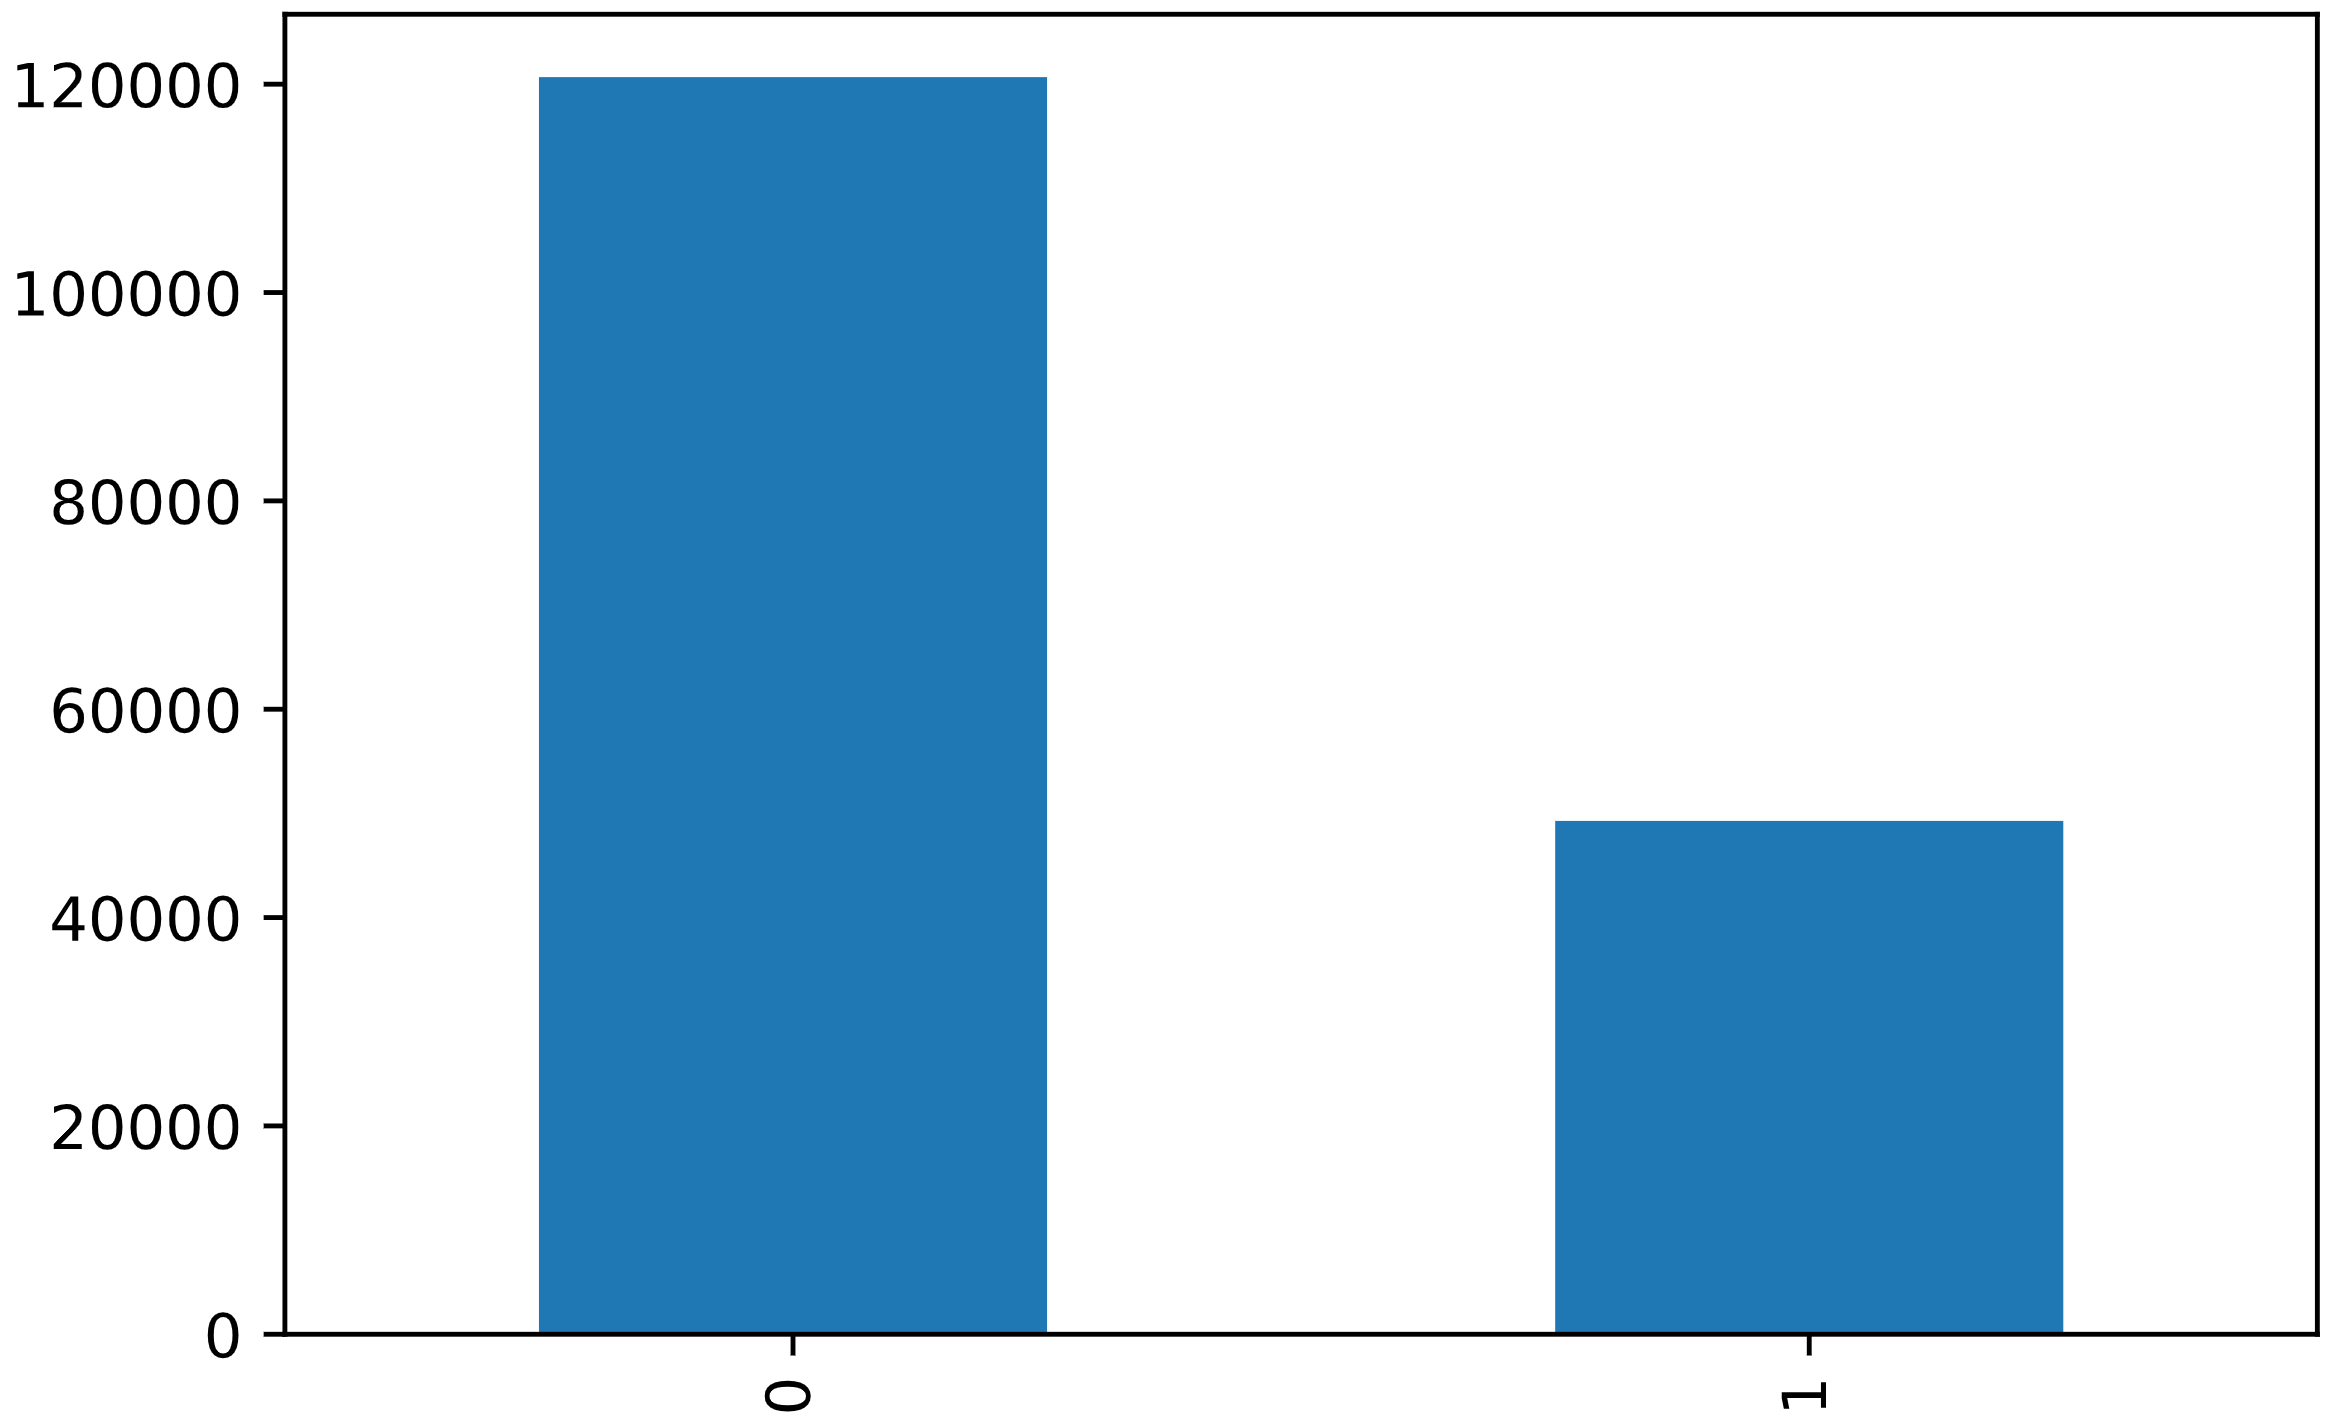
df['LIGHTCOND'].value_counts().plot(kind = 'bar')
plt.show()
Model Development
To build the model we’ll use the k-Nearest Neighbours (kNN) algorithm. Essentially, the kNN algorithm thinks that observations with similar characteristics will have similar outcomes.
from sklearn.model_selection import cross_val_score
from sklearn.datasets import load_iris
from sklearn.model_selection import train_test_split
from sklearn.neighbors import KNeighborsClassifier
from sklearn import metrics
The y variable will be the severity code. This is what we’re trying to predict. The x variable will be the weather, light conditions, and road conditions. These characteristics are what the model will use to predict the severity code.
y = df['SEVERITYCODE']
x = df[['WEATHER', 'LIGHTCOND', 'ROADCOND']].values
Now we split the data into a training set and a test set. The training set is what the model will use to identify patterns and the test set will evaluate the accuracy.
from sklearn.model_selection import train_test_split
x_train, x_test, y_train, y_test = train_test_split( x, y, test_size=0.1, random_state=5)
print ('Training set:', x_train.shape,  y_train.shape)
print ('Test set:', x_test.shape,  y_test.shape)
Training set: (152961, 3) (152961,)
Test set: (16996, 3) (16996,)
from sklearn.neighbors import KNeighborsClassifier
k = 5
neigh = KNeighborsClassifier(n_neighbors = k).fit(x_train,y_train)
yhat = neigh.predict(x_test)
from sklearn import metrics
print("Training set accuracy: ", metrics.accuracy_score(y_train, neigh.predict(x_train)))
print("Test set accuracy: ", metrics.accuracy_score(y_test, yhat))
Training set accuracy: 0.6716091029739607
Test set accuracy: 0.6684514003294892
Ks = 10
mean_acc = np.zeros((Ks-1))
std_acc = np.zeros((Ks-1))
for n in range(1,Ks):

    neigh = KNeighborsClassifier(n_neighbors = n).fit(x_train,y_train)
    yhat=neigh.predict(x_test)
    mean_acc[n-1] = metrics.accuracy_score(y_test, yhat)
    std_acc[n-1]=np.std(yhat==y_test)/np.sqrt(yhat.shape[0])

mean_acc
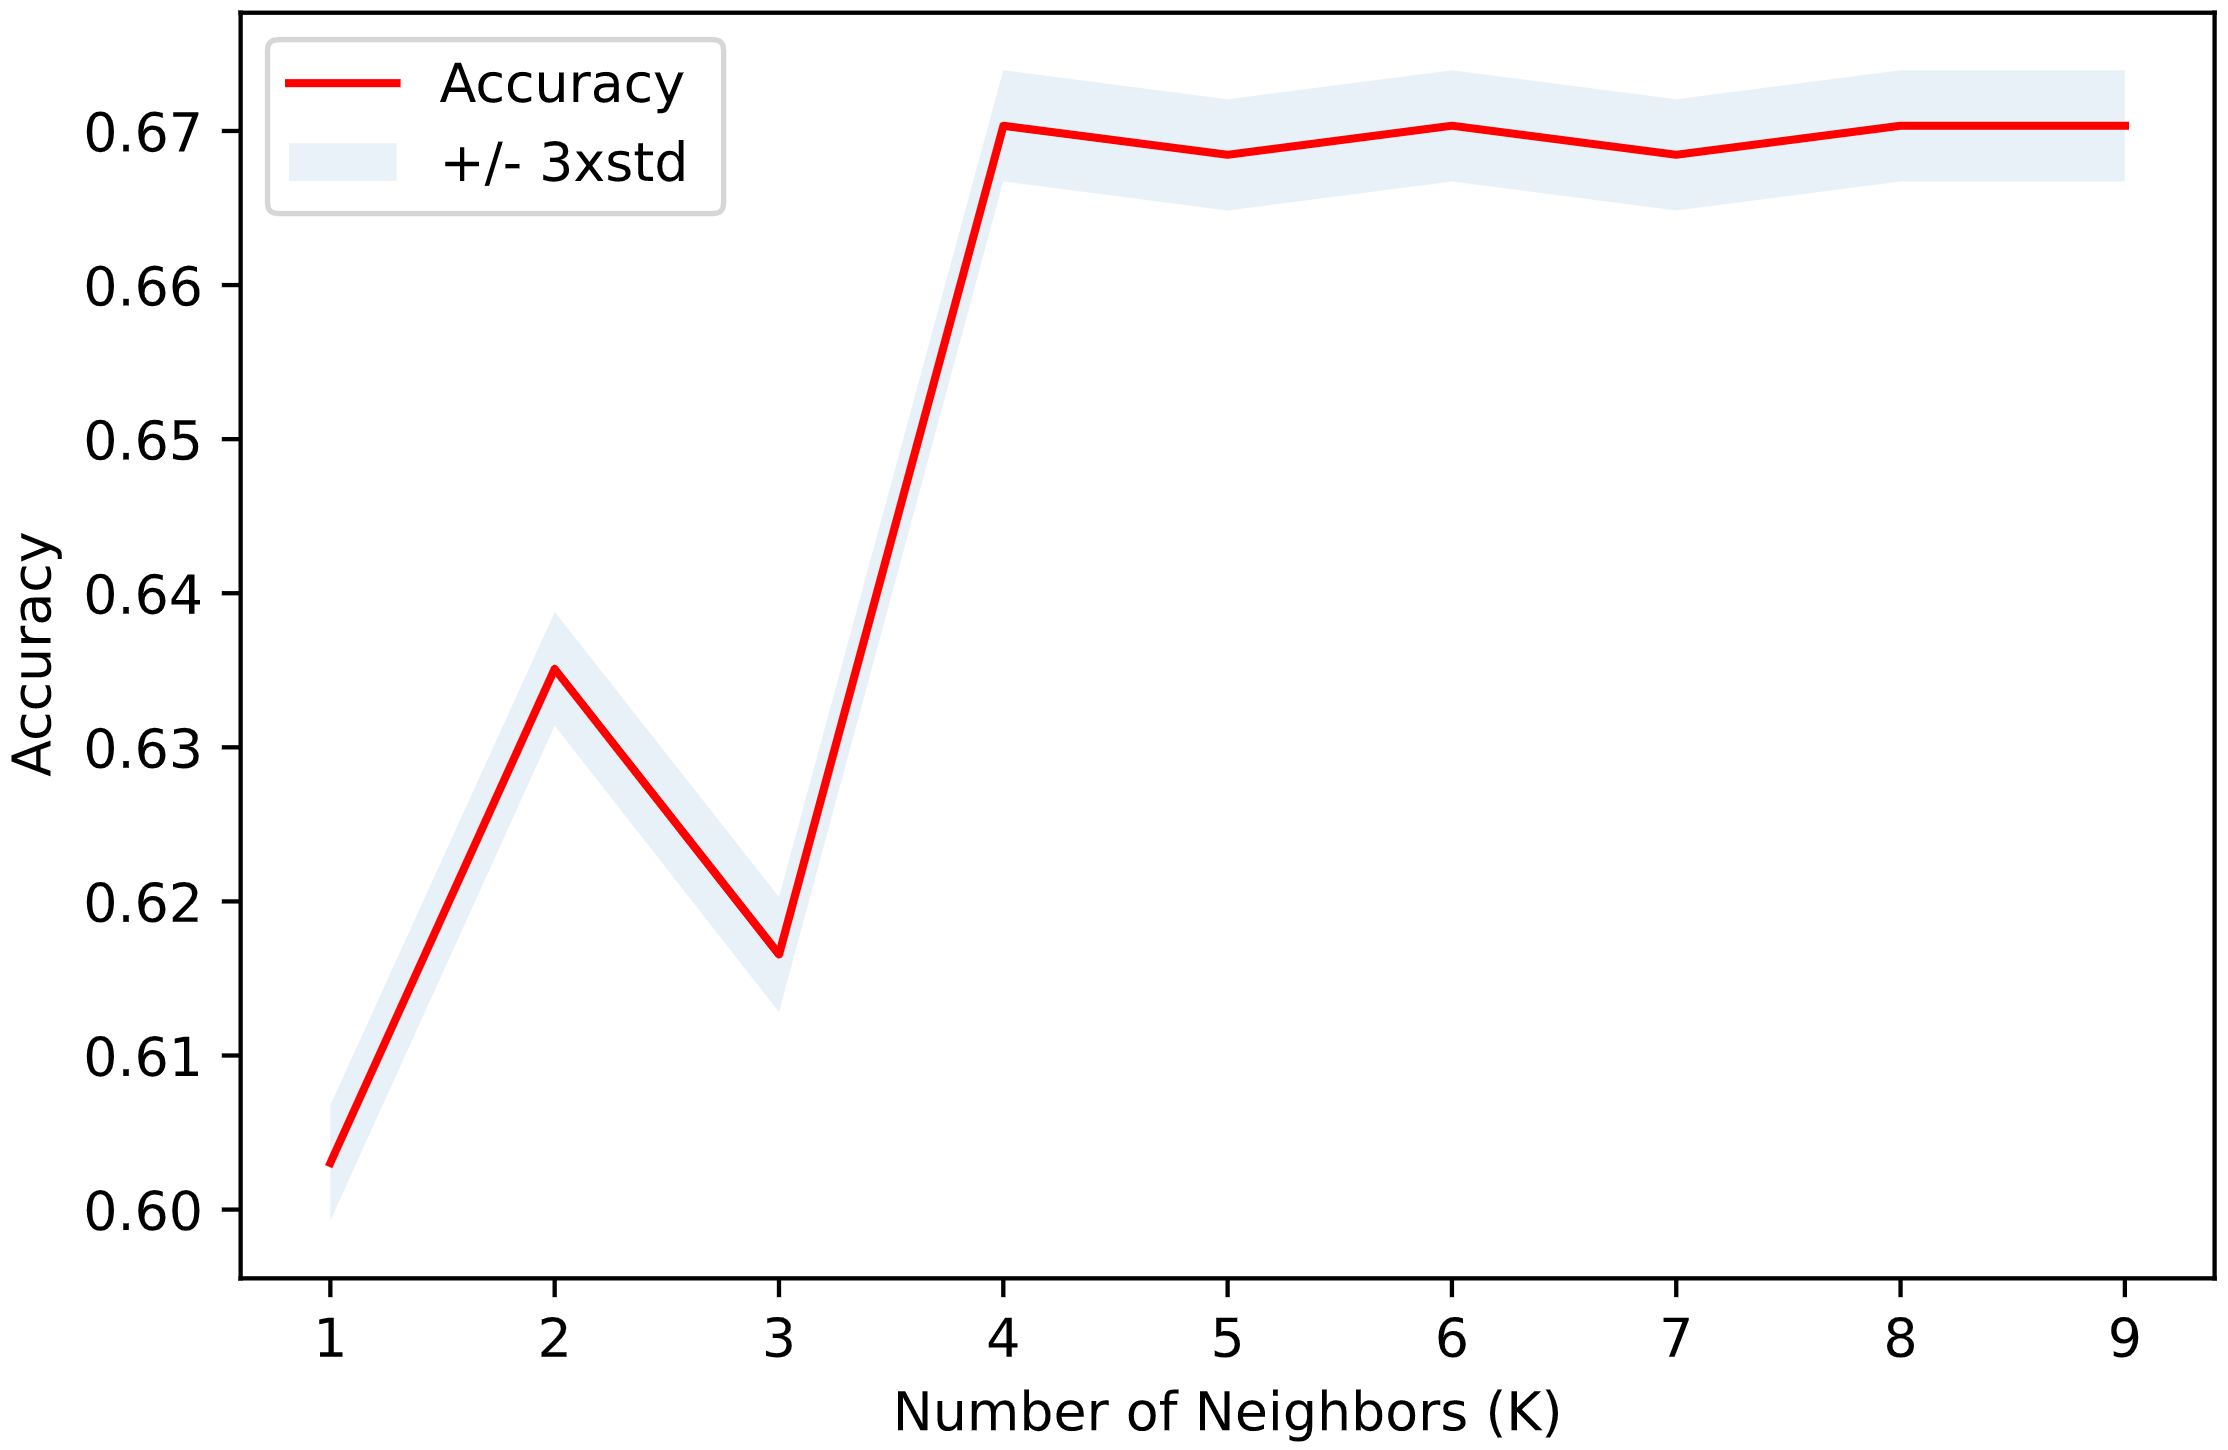
array([0.60302424, 0.63509061, 0.61655684, 0.6703342 , 0.6684514 , 0.6703342 , 0.6684514 , 0.6703342 , 0.6703342 ])
plt.plot(range(1,Ks),mean_acc,'red')
plt.fill_between(range(1,Ks),mean_acc - 1 * std_acc,mean_acc + 1 * std_acc, alpha=0.10)
plt.legend(('Accuracy ', '+/- 3xstd'))
plt.ylabel('Accuracy ')
plt.xlabel('Number of Neighbors (K)')
plt.tight_layout()
plt.show()
Conclusion
Knowing only the weather, road conditions, and light conditions we can predict with 67% accuracy how severe a car accident is.

Twitter
Facebook
Reddit
LinkedIn